Advantages of interactive graphics
In interactive Computer Graphics user have some controls over the picture, i.e., the user can make any change in the produced image.
Interactive Computer Graphics require two-way communication between the computer and the user. A User can see the image and make any change by sending his command with an input device.
Advantages:
- Higher Quality
- More precise results or products
- Greater Productivity
- Lower analysis and design cost
- Significantly enhances our ability to understand data and to perceive trends.
Representative use of computer graphics
The use of computer graphics is wide spread. It is used in various areas such as industry, business, government organizations, education, entertainment and most recently the home. User friendliness is one of the main factors underlying the success and popularity of any system. It is now a well established fact that graphical interfaces provide in attractive and easy interaction between users and computers.
In industry, business, government and educational organizations, computer graphics is most commonly used to create 2D and 3D graphics of mathematical, physical and economic functions in form of histograms, bars, and pie-chats. These graphs and charts are very useful for decision making.
The desktop publishing on personal computers allow the use of graphics for the creation and dissemination of information. Many organizations does the in-house creation and dissemination of documents. The desktop publishing allows user to create documents which contain text, tables, graphs, and other forms of drawn or scanned images or pictures. This is one approach towards the office automation.The computer-aided drafting uses graphics to design components and systems electrical, mechanical, electromechanical and electronic devices such as automobile bodies, structures of building, airplane, slips, very large-scale integrated chips, optical systems and computer networks.
Use of graphics in simulation makes mathematic models and mechanical systems more realistic and easy to study. The interactive graphics supported by animation software proved their use in production of animated movies and cartoons films.
There is lot of development in the tools provided by computer graphics. This allows user to create artistic pictures which express messages and attract attentions. Such pictures are very useful in advertising.
Conceptual Framework for Interactive Graphics
Conceptual Framework has the following elements:
– Graphics Library – Between application and display hardware there is graphics library / API.
– Application Program – An application program maps all application objects to images by invoking graphics.
– Graphics System – An interface that interacts between Graphics library and Hardware.
– Modifications to images are the result of user interaction.
Scan Converting a Straight Line
A straight line may be defined by two endpoints & an equation. In fig the two endpoints are described by (x1,y1) and (x2,y2). The equation of the line is used to determine the x, y coordinates of all the points that lie between these two endpoints.
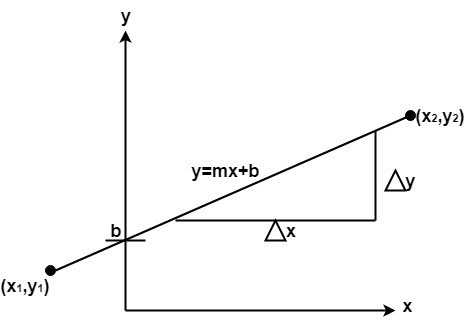
Using the equation of a straight line, y = mx + b where m =  & b = the y interrupt, we can find values of y by incrementing x from x =x1, to x = x2. By scan-converting these calculated x, y values, we represent the line as a sequence of pixels.
Algorithm for drawing line using equation:
Step1: Start Algorithm
Step2: Declare variables x1,x2,y1,y2,dx,dy,m,b,
Step3: Enter values of x1,x2,y1,y2.
The (x1,y1) are co-ordinates of a starting point of the line.
The (x2,y2) are co-ordinates of a ending point of the line.
Step4: Calculate dx = x2– x1
Step5: Calculate dy = y2-y1
Step6: Calculate m = 
Step7: Calculate b = y1-m* x1
Step8: Set (x, y) equal to starting point, i.e., lowest point and xendequal to largest value of x.
If dx < 0
then x = x2
y = y2
xend= x1
If dx > 0
then x = x1
y = y1
xend= x2
Step9: Check whether the complete line has been drawn if x=xend, stop
Step10: Plot a point at current (x, y) coordinates
Step11: Increment value of x, i.e., x = x+1
Step12: Compute next value of y from equation y = mx + b
Step13: Go to Step9.
Program to draw a line using LineSlope Method
- #include <graphics.h>
- #include <stdlib.h>
- #include <math.h>
- #include <stdio.h>
- #include <conio.h>
- #include <iostream.h>
- class bresen
- {
- float x, y, x1, y1, x2, y2, dx, dy, m, c, xend;
- public:
- void get ();
- void cal ();
- };
- void main ()
- {
- bresen b;
- b.get ();
- b.cal ();
- getch ();
- }
- Void bresen :: get ()
- {
- print (“Enter start & end points”);
- print (“enter x1, y1, x2, y2”);
- scanf (“%f%f%f%f”,sx1, sx2, sx3, sx4)
- }
- void bresen ::cal ()
- {
- /* request auto detection */
- int gdriver = DETECT,gmode, errorcode;
- /* initialize graphics and local variables */
- initgraph (&gdriver, &gmode, ” “);
- /* read result of initialization */
- errorcode = graphresult ();
- if (errorcode ! = grOK) /*an error occurred */
- {
- printf(“Graphics error: %s \n”, grapherrormsg (errorcode);
- printf (“Press any key to halt:”);
- getch ();
- exit (1); /* terminate with an error code */
- }
- dx = x2-x1;
- dy=y2-2y1;
- m = dy/dx;
- c = y1 – (m * x1);
- if (dx<0)
- {
- x=x2;
- y=y2;
- xend=x1;
- }
- else
- {
- x=x1;
- y=y1;
- xend=x2;
- }
- while (x<=xend)
- {
- putpixel (x, y, RED);
- y++;
- y=(x*x) +c;
- }
- }
scan converting a Circle:
Circle is an eight-way symmetric figure. The shape of circle is the same in all quadrants. In each quadrant, there are two octants. If the calculation of the point of one octant is done, then the other seven points can be calculated easily by using the concept of eight-way symmetry.
For drawing, circle considers it at the origin. If a point is P1(x, y), then the other seven points will be
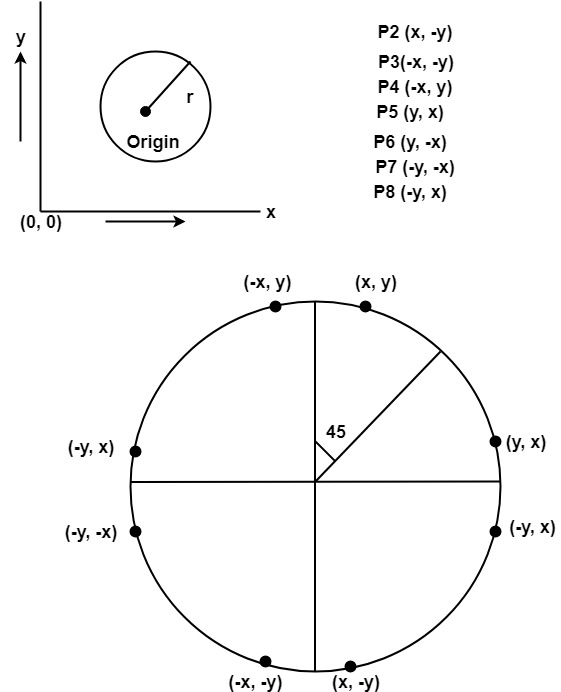
So we will calculate only 45°arc. From which the whole circle can be determined easily.
If we want to display circle on screen then the putpixel function is used for eight points as shown below:
putpixel (x, y, color)
putpixel (x, -y, color)
putpixel (-x, y, color)
putpixel (-x, -y, color)
putpixel (y, x, color)
putpixel (y, -x, color)
putpixel (-y, x, color)
putpixel (-y, -x, color)
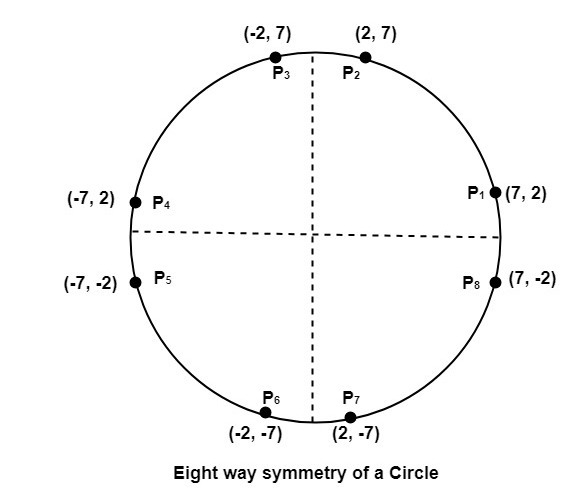
Example: Let we determine a point (2, 7) of the circle then other points will be (2, -7), (-2, -7), (-2, 7), (7, 2), (-7, 2), (-7, -2), (7, -2)
These seven points are calculated by using the property of reflection. The reflection is accomplished in the following way:
The reflection is accomplished by reversing x, y co-ordinates.
There are two standards methods of mathematically defining a circle centered at the origin.
- Defining a circle using Polynomial Method
- Defining a circle using Polar Co-ordinates
Program to draw a circle using Polynomial Method:
- #include<graphics.h>
- #include<conio.h>
- #include<math.h>
- voidsetPixel(int x, int y, int h, int k)
- {
- putpixel(x+h, y+k, RED);
- putpixel(x+h, -y+k, RED);
- putpixel(-x+h, -y+k, RED);
- putpixel(-x+h, y+k, RED);
- putpixel(y+h, x+k, RED);
- putpixel(y+h, -x+k, RED);
- putpixel(-y+h, -x+k, RED);
- putpixel(-y+h, x+k, RED);
- }
- main()
- {
- intgd=0, gm,h,k,r;
- double x,y,x2;
- h=200, k=200, r=100;
- initgraph(&gd, &gm, “C:\\TC\\BGI “);
- setbkcolor(WHITE);
- x=0,y=r;
- x2 = r/sqrt(2);
- while(x<=x2)
- {
- y = sqrt(r*r – x*x);
- setPixel(floor(x), floor(y), h,k);
- x += 1;
- }
- getch();
- closegraph();
- return 0;
- }
Program to draw a circle using Polar Coordinates:
- #include <graphics.h>
- #include <stdlib.h>
- #define color 10
- void eightWaySymmetricPlot(int xc,int yc,int x,int y)
- {
- putpixel(x+xc,y+yc,color);
- putpixel(x+xc,-y+yc,color);
- putpixel(-x+xc,-y+yc,color);
- putpixel(-x+xc,y+yc,color);
- putpixel(y+xc,x+yc,color);
- putpixel(y+xc,-x+yc,color);
- putpixel(-y+xc,-x+yc,color);
- putpixel(-y+xc,x+yc,color);
- }
- void PolarCircle(int xc,int yc,int r)
- {
- int x,y,d;
- x=0;
- y=r;
- d=3-2*r;
- eightWaySymmetricPlot(xc,yc,x,y);
- while(x<=y)
- {
- if(d<=0)
- {
- d=d+4*x+6;
- }
- else
- {
- d=d+4*x-4*y+10;
- y=y-1;
- }
- x=x+1;
- eightWaySymmetricPlot(xc,yc,x,y);
- }
- }
- int main(void)
- {
- int gdriver = DETECT, gmode, errorcode;
- int xc,yc,r;
- initgraph(&gdriver, &gmode, “c:\\turboc3\\bgi”);
- errorcode = graphresult();
- if (errorcode != grOk)
- {
- printf(“Graphics error: %s\n”, grapherrormsg(errorcode));
- printf(“Press any key to halt:”);
- getch();
- exit(1);
- }
- printf(“Enter the values of xc and yc ,that is center points of circle : “);
- scanf(“%d%d”,&xc,&yc);
- printf(“Enter the radius of circle : “);
- scanf(“%d”,&r);
- PolarCircle(xc,yc,r);
- getch();
- closegraph();
- return 0;
- }
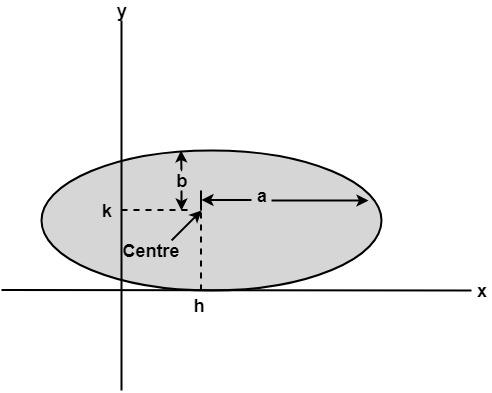
Scan Converting a Ellipse:
The ellipse is also a symmetric figure like a circle but is four-way symmetry rather than eight-way.
Program to Implement Ellipse Drawing Algorithm:
- #include<stdio.h>
- #include<conio.h>
- #include<graphics.h>
- #include<math.h>
- void disp();
- float x,y;
- intxc,yc;
- void main()
- {
- intgd=DETECT,gm,a,b;
- float p1,p2;
- clrscr();
- initgraph(&gd,&gm,”c:\\turboc3\\bgi”);
- printf(“*** Ellipse Generating Algorithm ***\n”);
- printf(“Enter the value of Xc\t”);
- scanf(“%d”,&xc);
- printf(“Enter the value of yc\t”);
- scanf(“%d”,&yc);
- printf(“Enter X axis length\t”);
- scanf(“%d”,&a);
- printf(“Enter Y axis length\t”);
- scanf(“%d”,&b);
- x=0;y=b;
- disp();
- p1=(b*b)-(a*a*b)+(a*a)/4;
- while((2.0*b*b*x)<=(2.0*a*a*y))
- {
- x++;
- if(p1<=0)
- p1=p1+(2.0*b*b*x)+(b*b);
- else
- {
- y–;
- p1=p1+(2.0*b*b*x)+(b*b)-(2.0*a*a*y);
- }
- disp();
- x=-x;
- disp();
- x=-x;
- delay(50);
- }
- x=a;
- y=0;
- disp();
- p2=(a*a)+2.0*(b*b*a)+(b*b)/4;
- while((2.0*b*b*x)>(2.0*a*a*y))
- {
- y++;
- if(p2>0)
- p2=p2+(a*a)-(2.0*a*a*y);
- else
- {
- x–;
- p2=p2+(2.0*b*b*x)-(2.0*a*a*y)+(a*a);
- }
- disp();
- y=-y;
- disp();
- y=-y;
- delay(50);
- }
- getch();
- closegraph();
- }
- void disp()
- {
- putpixel(xc+x,yc+y,7);
- putpixel(xc-x,yc+y,7);
- putpixel(xc+x,yc-y,7);
- putpixel(xc+x,yc-y,7);
- }
