Information Requirements Analysis is the process of determining the data and information needs of an organization or system to support its goals and objectives. This involves identifying and defining the type, format, and content of the data and information required, as well as the sources of this information. The purpose of Information Requirements Analysis is to provide a comprehensive understanding of the information that is necessary to support the goals and objectives of a system, organization, or process, and to ensure that all necessary information is available, accurate, and accessible.
The process of Information Requirements Analysis typically includes the following steps:
- Identifying stakeholders: This involves identifying the individuals and groups who will use or be impacted by the information and their specific requirements.
- Defining the business requirements: This involves understanding the business goals and objectives and the information needed to support them.
- Determining the data sources: This involves identifying the internal and external sources of data and information that will be used to support the business requirements.
- Evaluating the existing data: This involves analyzing the data currently available and assessing its quality, accuracy, and relevance.
- Defining data and information requirements: This involves specifying the type, format, and content of the data and information required to support the business requirements.
- Designing the information architecture: This involves defining the structure, organization, and relationships of the data and information required to support the business requirements.
- Validation and verification: This involves ensuring that the information requirements are accurate and complete and that the data sources and information architecture are suitable to support the business requirements.
Information Requirements Analysis is an important step in the development of any system, organization, or process as it ensures that the necessary information is available, accurate, and accessible to support the goals and objectives of the system.
Process modelling with physical logical data flow diagrams
Process modeling involves creating visual representations of business processes in order to understand and improve them. Physical and logical data flow diagrams are two types of diagrams used in process modeling.
Physical Data Flow Diagrams (PDFDs) are graphical representations of the movement of data from its origin to its final destination. They depict the physical flow of information between people, systems, and storage media. PDFDs show how data is transformed from one format to another and how it is stored, retrieved, and transmitted.
Logical Data Flow Diagrams (LDPDs), on the other hand, depict the processing of data as it moves through a system. They show the logic behind the processing of data, including the transformations that take place, without emphasizing the physical aspect of the flow. LDFDs are used to identify the inputs, processing, and outputs of a system.
Both physical and logical data flow diagrams are useful in process modeling because they provide different perspectives on the flow of data in a system. PDFDs give a clear picture of the physical path that data takes, while LDFDs show the logic behind the processing of the data. By using both diagrams in conjunction, organizations can gain a complete understanding of their business processes and identify areas for improvement.
Components of Data Flow Diagram:
Following are the components of the data flow diagram that are used to represent source, destination, storage and flow of data.
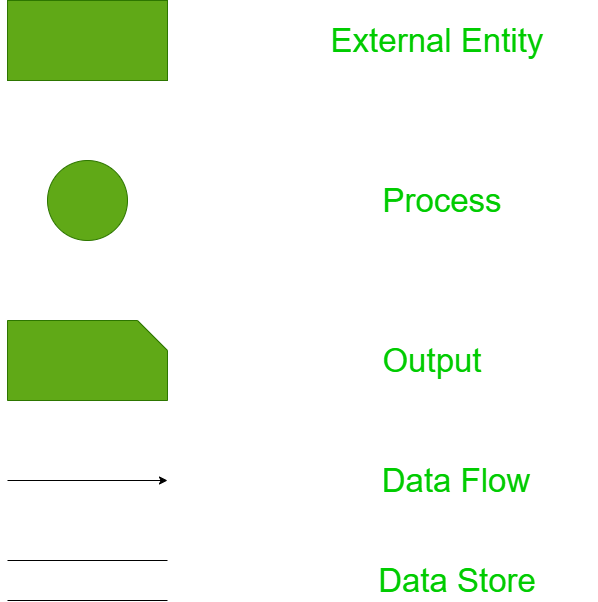
- Entities:
Entities include source and destination of the data. Entities are represented by rectangle with their corresponding names. - Process:
The tasks performed on the data is known as process. Process is represented by circle. Somewhere round edge rectangles are also used to represent process. - Data Storage:
Data storage includes the database of the system. It is represented by rectangle with both smaller sides missing or in other words within two parallel lines. - Data Flow:
The movement of data in the system is known as data flow. It is represented with the help of arrow. The tail of the arrow is source and the head of the arrow is destination.
Importance of Data Flow Diagram:
Data flow diagram is a simple formalism to represent the flow of data in the system. It allows a simple set of intuitive concepts and rules. It is an elegant technique that is useful to represent the results of structured analysis of software problem as well as to represent the flow of documents in an organization.
Data modeling is the process of creating a conceptual representation of data and the relationships between data elements. Logical Entity Relationship Diagrams (ERDs) are a type of data model that is used to depict the relationships between entities in a system.
An entity is an object or concept that exists within the system and has attributes, or characteristics, that describe it. In a logical ERD, entities are represented by rectangles, and the relationships between them are represented by lines connecting the entities.
The relationships between entities in a logical ERD can be one-to-one, one-to-many, or many-to-many. These relationships are depicted using arrows on the lines connecting the entities. For example, a one-to-many relationship might be represented by an arrow pointing from a “Department” entity to an “Employee” entity, indicating that one department can have many employees, but each employee belongs to only one department.
Logical ERDs are useful for understanding the relationships between entities in a system, and for communicating this understanding to others. They can also be used to design and implement a database, as well as to validate the design and ensure that it meets the needs of the business.
Overall, logical ERDs are an important tool in data modeling, as they help organizations understand the relationships between data elements and design databases that are efficient and meet their business needs.
ER (Entity Relationship) Diagram in DBMS
- ER model stands for an Entity-Relationship model. It is a high-level data model. This model is used to define the data elements and relationship for a specified system.
- It develops a conceptual design for the database. It also develops a very simple and easy to design view of data.
- In ER modeling, the database structure is portrayed as a diagram called an entity-relationship diagram.
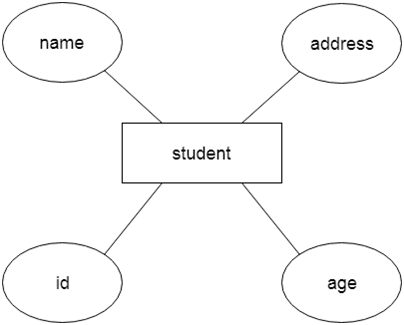
For example, Suppose we design a school database. In this database, the student will be an entity with attributes like address, name, id, age, etc. The address can be another entity with attributes like city, street name, pin code, etc and there will be a relationship between them.
Component of ER Diagram
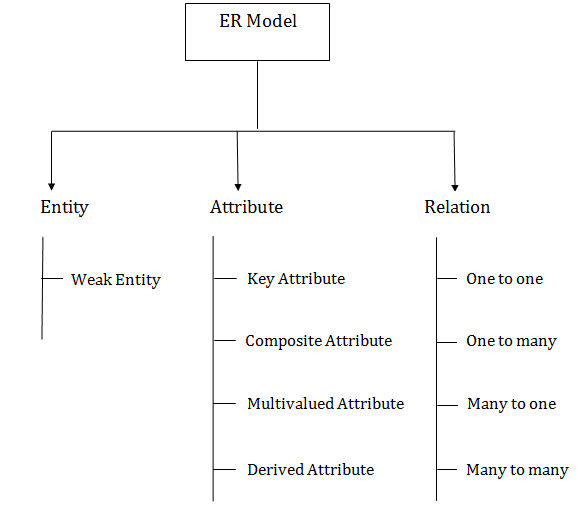
1. Entity:
An entity may be any object, class, person or place. In the ER diagram, an entity can be represented as rectangles.
Consider an organization as an example- manager, product, employee, department etc. can be taken as an entity.
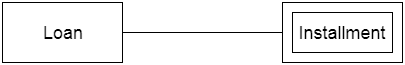
a. Weak EntityPlay Video
https://imasdk.googleapis.com/js/core/bridge3.553.0_en.html#goog_988288928
An entity that depends on another entity called a weak entity. The weak entity doesn’t contain any key attribute of its own. The weak entity is represented by a double rectangle.
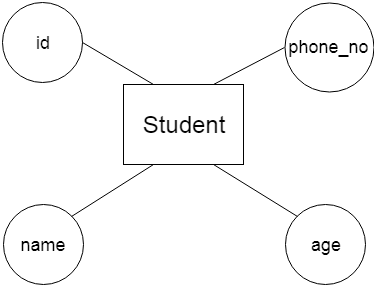
2. Attribute
The attribute is used to describe the property of an entity. Eclipse is used to represent an attribute.
For example, id, age, contact number, name, etc. can be attributes of a student.
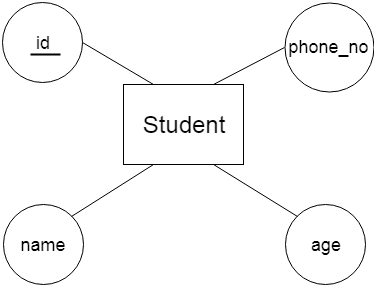
a. Key Attribute
The key attribute is used to represent the main characteristics of an entity. It represents a primary key. The key attribute is represented by an ellipse with the text underlined.
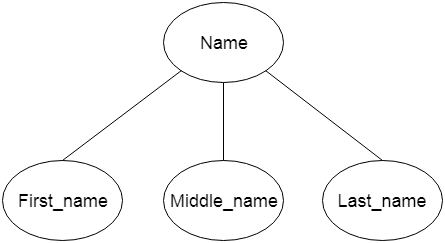
b. Composite Attribute
An attribute that composed of many other attributes is known as a composite attribute. The composite attribute is represented by an ellipse, and those ellipses are connected with an ellipse.
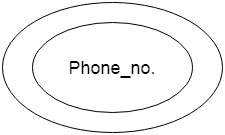
c. Multivalued Attribute
An attribute can have more than one value. These attributes are known as a multivalued attribute. The double oval is used to represent multivalued attribute.
For example, a student can have more than one phone number.
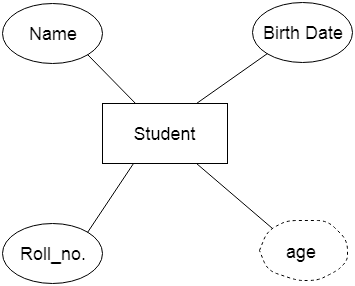
d. Derived Attribute
An attribute that can be derived from other attribute is known as a derived attribute. It can be represented by a dashed ellipse.
For example, A person’s age changes over time and can be derived from another attribute like Date of birth.
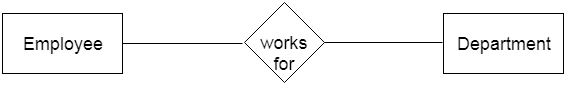
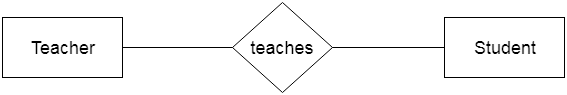
3. Relationship
A relationship is used to describe the relation between entities. Diamond or rhombus is used to represent the relationship.
Types of relationship are as follows:
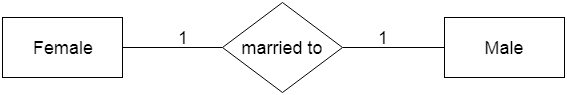
a. One-to-One Relationship
When only one instance of an entity is associated with the relationship, then it is known as one to one relationship.
For example, A female can marry to one male, and a male can marry to one female.
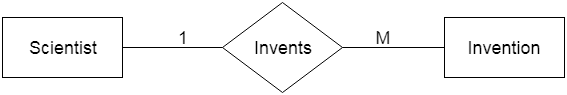
b. One-to-many relationship
When only one instance of the entity on the left, and more than one instance of an entity on the right associates with the relationship then this is known as a one-to-many relationship.
For example, Scientist can invent many inventions, but the invention is done by the only specific scientist.
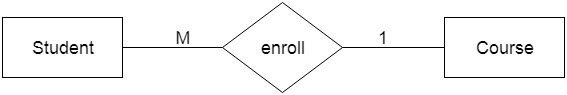
c. Many-to-one relationship
When more than one instance of the entity on the left, and only one instance of an entity on the right associates with the relationship then it is known as a many-to-one relationship.
For example, Student enrolls for only one course, but a course can have many students.
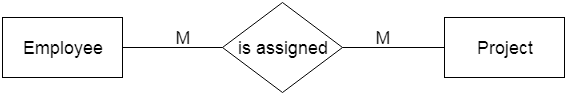
d. Many-to-many relationship
When more than one instance of the entity on the left, and more than one instance of an entity on the right associates with the relationship then it is known as a many-to-many relationship.
For example, Employee can assign by many projects and project can have many employees.