A measure of central tendency is a statistical calculation used to determine a single value that summarizes the central location of a set of data. The central location of the data provides a quick summary of the main characteristics of the data, which can be useful in making predictions or drawing conclusions about the data. There are three common measures of central tendency: mean, median, and mode.
- Mean: The mean, or average, is calculated by adding up all the values in the data set and then dividing by the number of values. The mean provides a good representation of the central location of the data if the data is evenly distributed. However, if there are extreme values in the data set, the mean can be significantly impacted, making it a less reliable measure of central tendency.
- Median: The median is the middle value of a data set when the values are ordered from smallest to largest. It provides a good representation of the central location of the data if there are extreme values in the data set, as it is not affected by outliers.
- Mode: The mode is the value that occurs most frequently in a data set. The mode can provide a good representation of the central location of the data if the data is not evenly distributed, such as in the case of categorical data.
In conclusion, the appropriate measure of central tendency to use depends on the type and distribution of the data, as well as the goals of the analysis.
concept of central tendency
Central tendency refers to a single value or typical value that summarizes the central location of a set of data. The idea is to find a single value that best represents the “center” of the data and gives a quick summary of its main characteristics. There are several measures of central tendency, including mean, median, and mode. Each measure provides a different perspective on the central location of the data and may be more or less appropriate depending on the type and distribution of the data, as well as the goals of the analysis.
Mean, median, and mode are three common measures of central tendency. Mean (average) is calculated by summing up all the values in a data set and dividing by the number of values. Median is the middle value of a data set when the values are ordered from smallest to largest. Mode is the value that occurs most frequently in a data set.
In general, mean is a good representation of central tendency if the data is evenly distributed, but it can be significantly impacted by extreme values (outliers). Median provides a good representation of central tendency if there are outliers, as it is not affected by extreme values. Mode provides a good representation of central tendency if the data is not evenly distributed, such as in the case of categorical data.
Central tendency is a useful tool in data analysis, as it provides a simple and quick summary of a large and complex data set. It can also help identify patterns, make predictions, and draw conclusions about the data
quirements of good measures of central tendency
For a measure of central tendency to be considered “good”, it should satisfy the following requirements:
- Uniqueness: There should be a single value that summarizes the central location of the data, not multiple values or ranges.
- Representativeness: The measure should provide an accurate representation of the central location of the data, capturing its main characteristics.
- Stability: The measure should not change significantly with small variations in the data set.
- Insensitivity to extreme values: The measure should not be greatly affected by outliers or extreme values in the data set.
Example: Suppose we have the following data set: 1, 2, 3, 4, 1000
Mean: (1 + 2 + 3 + 4 + 1000) / 5 = 200.8
Median: 3 (when the values are ordered from smallest to largest)
Mode: None (no value occurs more than once)
In this example, the median is a better measure of central tendency as it is not greatly affected by the extreme value of 1000. The mean is significantly impacted by this value and is not representative of the central location of the data. The lack of a mode suggests that this is not a good measure of central tendency for this data set.
Arithmetic mean
The arithmetic mean, also known as the average, is calculated by summing up all the values in a data set and dividing by the number of values. Here’s how to calculate the arithmetic mean with an example:
Example: Suppose we have the following data set of 5 values: 2, 4, 5, 8, 9
Step 1: Sum up all the values: 2 + 4 + 5 + 8 + 9 = 28
Step 2: Divide the sum by the number of values (n): 28 ÷ 5 = 5.6
Step 3: The result, 5.6, is the arithmetic mean of the data set.
So, the average of the data set is 5.6. This value provides a single representation of the central location of the data and can be used for making predictions or drawing conclusions about the data.
Median
Median is a measure of central tendency that represents the middle value of a set of data when the values are ordered from smallest to largest. The median provides a good representation of the central location of the data if there are extreme values or outliers, as it is not affected by these values.
Here’s how to calculate the median with an example:
Example: Suppose we have the following data set of 7 values: 2, 4, 6, 8, 9, 10, 12
Step 1: Order the values from smallest to largest: 2, 4, 6, 8, 9, 10, 12
Step 2: If the number of values in the data set is odd, the median is the middle value. In this case, the median is 9.
Step 3: If the number of values in the data set is even, the median is the average of the two middle values. In this case, the median is (8 + 9) / 2 = 8.5.
So, the median of this data set is 8.5. This value provides a good representation of the central location of the data, as it is not affected by the presence of extreme values
Median Formula for Ungrouped Data
The following steps are helpful while applying the median formula for ungrouped data.
- Step 1: Arrange the data in ascending or descending order.
- Step 2: Secondly, count the total number of observations ‘n’.
- Step 3: Check if the number of observations ‘n’ is even or odd.
Median Formula When n is Odd
The median formula of a given set of numbers, say having ‘n’ odd number of observations, can be expressed as:
Median = [(n + 1)/2]th term

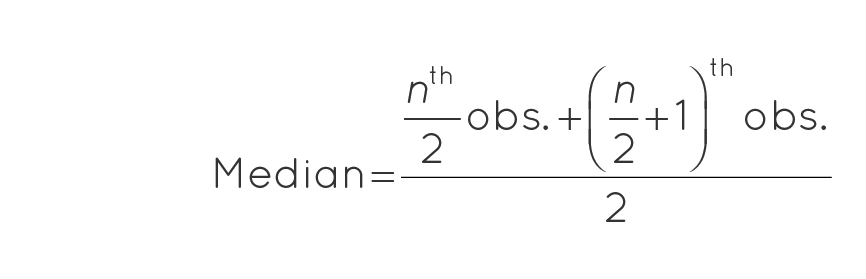
Median Formula When n is Even
The median formula of a given set of numbers say having ‘n’ even number of observations, can be expressed as:
Median = [(n/2)th term + ((n/2) + 1)th term]/2
Example: The age of the members of a weekend poker team has been listed below. Find the median of the above set.
{42, 40, 50, 60, 35, 58, 32}
Solution:
Step 1: Arrange the data items in ascending order.
Original set: {42, 40, 50, 60, 35, 58, 32}
Ordered Set: {32, 35, 40, 42, 50, 58, 60}
Step 2: Count the number of observations. If the number of observations is odd, then we will use the following formula: Median = [(n + 1)/2]th term
Step 3: Calculate the median using the formula.
Median = [(n + 1)/2]th term
= (7 + 1)/2th term = 4th term = 42
Median = 42
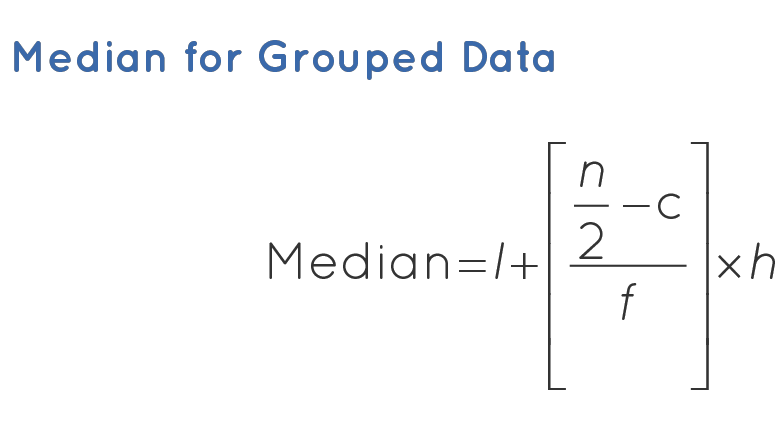
Median Formula for Grouped Data
When the data is continuous and in the form of a frequency distribution, the median is calculated through the following sequence of steps.
- Step 1: Find the total number of observations(n).
- Step 2: Define the class size(h), and divide the data into different classes.
- Step 3: Calculate the cumulative frequency of each class.
- Step 4: Identify the class in which the median falls. (Median Class is the class where n/2 lies.)
- Step 5: Find the lower limit of the median class(l), and the cumulative frequency of the class preceding the median class (c).
Now, use the following formula to find the median value.
Application of Median Formula
Let us use the above steps in the following practical illustration to understand the application of the median formula.
Illustration: There are 5 top management employees in an organization. The salaries given to the employees are $5,000, $6,000, $4,000, $8,000, and $7,500. Using the median formula calculates the median salary.
Solution: We will follow the given steps to find the median salary.
- Step 1: Sorting the given data in increasing order, $4,000, $5,000, $6,000, $7,500, and $8,000.
- Step 2: Total number of observations = 5
- Step 3: The given number of observations is odd.
- Step 4: Using median formula for odd observation, Median = [(n + 1)/2]th term
- Median = [(5+1)/2]th term. = 6/3 = 3rd term. The third term is $6,000.
The median salary is $6,000.
How to Find Median?
We use a median formula to find the median value of given data. For a set of ungrouped data, we can follow the below-given steps to find the median value.
- Step 1: Sort the given data in increasing order.
- Step 2: Count the number of observations.
- Step 3: If the number of observations is odd use median formula: Median = [(n + 1)/2]th term
- Step 4: If the number of observations is even use median formula: Median = [(n/2)th term + (n/2 + 1)th term]/2
Example: The height (in centimeters) of the members of a school football team have been listed below.
{142, 140, 130, 150, 160,135, 158,132}
Find the median of the above set.
Solution:
Step 1:
Arrange the data items in ascending order.
Original set: {142, 140, 130, 150, 160, 135, 158,132}
Ordered Set: {130, 132, 135, 140, 142, 150, 158, 160}
Step 2:
Count the number of observations.
Number of observations, n = 8
If number of observations is even, then we will use the following formula:
Median = [(n/2)th term + ((n/2) + 1)th term]/2
Step 3:
Calculate the median using the formula.
Median = [(n/2)th term + ((n/2) + 1)th term]/2
Median = [(8/2)th term + ((8/2) + 1)th term]/2
= (4th term + 5th term)/2
= (140 + 142)/2
= 141
For a set of grouped data, we can follow the following steps to find the median:
When the data is continuous and in the form of a frequency distribution, the median is calculated through the following sequence of steps.
- Step 1: Find the total number of observations(n).
- Step 2: Define the class size(h), and divide the data into different classes.
- Step 3: Calculate the cumulative frequency of each class.
- Step 4: Identify the class in which the median falls. (Median Class is the class where n/2 lies.)
- Step 5: Find the lower limit of the median class(l), and the cumulative frequency(c).
- Step 6: Apply the formula for median for grouped data: Median =l+[n2−cf]×h=�+[�2−��]×ℎ
mode
The mode is the value that occurs most frequently in a data set. It provides a good representation of central tendency for data sets that are not evenly distributed, such as categorical data.
Here’s how to calculate the mode with an example:
Example: Suppose we have the following data set of 6 values: 2, 4, 4, 6, 8, 8
Step 1: Count the frequency of each value in the data set:
Value: 2 Frequency: 1 Value: 4 Frequency: 2 Value: 6 Frequency: 1 Value: 8 Frequency: 2
Step 2: Find the value(s) with the highest frequency. In this case, both 4 and 8 have a frequency of 2.
Step 3: Both 4 and 8 are the modes of the data set, as they both occur with the same highest frequency.
So, the modes of this data set are 4 and 8. These values provide a good representation of central tendency for this data set, as they capture the most common values in the data. Note that it is possible for a data set to have more than one mode, or no mode at all.
The mode for ungrouped data
is the value that appears most frequently in the data set.
Example: Consider the following set of numbers: {1, 2, 2, 3, 4, 4, 4, 5}
The mode of this data set is 4, as it appears three times, which is more than any other value.
Formula
Statisticians use the mode formula in statistics to know the highest frequency in a group of data or distribution. They take the most repeated data as the Mode of distribution. It is one of the three important measures related to the central tendency besides mean and median.
Here is the formula that statisticians and analysts use in the calculation of a data set in statistics:
Modeg = L+h (fm-f1)/(fm-f1) + (fm-f2)
Where the modal class = the one with the highest frequency data interval;
- L = lower limit of the said modal class
- h = size of the class interval
- fm = modal class frequency
- f1 = frequency of the class which precedes the modal class; and
- f2 = frequency of the class which succeeds the modal class
Formula To Find The Mode Of Ungrouped Data
For doing so, one has to first arrange the data in ascending or descending manner in terms of their values. After the arranging, one must mark the data values, which are repeated more often. Amongst all the frequent data values, the one having the highest frequency of occurring in the data set is the modal value or the most common value for the set.
Formula To Find The Mode Of Grouped Data
To find the value of grouped data, one has to identify the class interval with the most frequency, known as the modal class. After doing so, one calculates the class size by subtracting the lower limit from the upper limit. Finally, statisticians use the the most common value formula to calculate the Mode for the grouped data after putting all the values in it, as shown below:
Mode = L+h (fm-f1)/(fm-f1) + (fm-f2)
Calculation Example
Here is a mode calculation example to understand the concept and its usage.
| Class Interval | 0−10 | 10−20 | 20−30 | 30−40 | 40−50 |
| Frequency | 8 | 5 | 10 | 4 | 7 |
Modal class = 20-30 as it has the data with the highest frequency
Size of the class interval, h= 10
The lower limit of the above modal class, L= 20
Frequency of the modal class, fm = 10
Frequency of the class which precedes the modal class, f1 = 5; and
Frequency of the class which succeeds the modal class f2 = 4
Therefore, putting all the values in the formula of mode, M =
L+h (fm-f1)/(fm-f1) + (fm-f2)
One can get Mode = 20 +10 (10-5)/ (10-5) + (10-4)
= 20+10*5/11
i.e., (220+50)/11
= 270/11
or, Mode= 24.54 for the above data set.
Example
As discussed below, the best way to understand the basics of this concept is through a mode example.
Let us assume an inventory manager has to know which stock is mostly purchased by the customers and must be replenished accordingly. Therefore, the inventory manager prepares a list of the items in the warehouse with the respective product type and purchase code as below:
| Purchase code | Product Type |
|---|---|
| A | SUNGLASSES |
| B | KIDS GARMENTS |
| C | LAPTOPS |
| D | MOBILE |
| E | SUNGLASSES |
| F | MOBILE |
| G | KIDS GARMENTS |
| H | LAPTOPS |
| I | MOBILE |
| J | SUNGLASSES |
| K | KIDS GARMENTS |
| L | MOBILE |
| M | LAPTOPS |
| N | MOBILE |
| O | KIDS GARMENTS |
For the most common value calculation, one should categorize the above data in the frequency of buying by the customers as below:
| Type | Frequency |
|---|---|
| SUNGLASSES | 3 |
| KIDS GARMENTS | 4 |
| LAPTOPS | 3 |
| MOBILE | 5 |
As a result of the table above, one finds that mobile is bought more frequently than other items in the warehouse inventory. Therefore, mobile is the mode of the data set of our example. Thus, the mode in statistics helps with inventory management.
Harmonic Mean, Geometric mean for grouped and ungrouped data.
The Harmonic Mean and the Geometric Mean are two types of average measures used in statistics.
For ungrouped data, the Harmonic Mean is calculated as the reciprocal of the arithmetic mean of the reciprocals of the individual values, and is used when finding the average rate, such as speed. The Geometric Mean, on the other hand, is calculated as the nth root of the product of n values, and is used when finding the average growth rate.
For grouped data, the Harmonic Mean is calculated by dividing the total number of observations by the sum of the reciprocals of the class frequencies, and the Geometric Mean is calculated by finding the nth root of the product of the class frequencies.
In general, the Harmonic Mean is a better measure of central tendency for data sets with extremely large or small values, while the Geometric Mean is a better measure for data sets with values close to each other
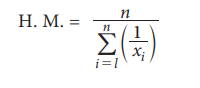
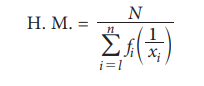
Harmonic Mean (H.M.)
Harmonic Mean is defined as the reciprocal of the arithmetic mean of reciprocals of the observations.
(a) H.M. for Ungrouped data
Let x1, x2, …, xn be the n observations then the harmonic mean is defined as
Example 5.11
A man travels from Jaipur to Agra by a car and takes 4 hours to cover the whole distance. In the first hour he travels at a speed of 50 km/hr, in the second hour his speed is 64 km/hr, in third hour his speed is 80 km/hr and in the fourth hour he travels at the speed of 55 km/hr. Find the average speed of the motorist.
Solution:
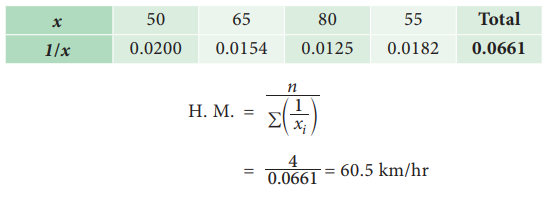
Average speed of the motorist is 60.5km/hr
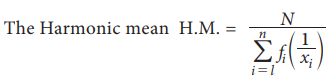
(b) H.M. for Discrete Grouped data:
For a frequency distribution
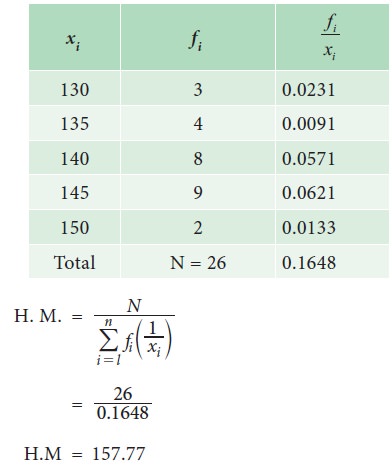
Example 5.12
The following data is obtained from the survey. Compute H.M
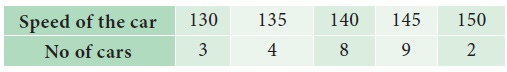
Solution:
(c) H.M. for Continuous data:
Where xi is the mid-point of the class interval
Geometric Mean
A geometric mean is a mean or average which shows the central tendency of a set of numbers by using the product of their values. For a set of n observations, a geometric mean is the nth root of their product. The geometric mean G.M., for a set of numbers x1, x2, … , xn is given as
G.M. = (x1. x2 … xn)1⁄n
or, G. M. = (π i = 1n xi) 1⁄n = n√( x1, x2, … , xn).
The geometric mean of two numbers, say x, and y is the square root of their product x×y. For three numbers, it will be the cube root of their products i.e., (x y z) 1⁄3.
